
Using automation to consolidate biodiversity occurrence data in South African National Parks
Judith Botha · Monday plenary programme
The short versionAutomating the harvest, integration and summary of biodiversity data lets park staff get evidence-based species lists and dashboards without laborious manual compilation.
What this was about
Judith Botha presented the SANParks Biodiversity Information Management System (BIMS), built with the Freshwater Research Centre and technical partner Kartoza. It brings together GBIF occurrence data, SANParks monitoring data and data captured from literature for South Africa's 21 national parks. The system produces annotated species checklists (needed for five-yearly park management plans), summary dashboards, Red List status and Red List Index trends, and climate station dashboards. Harvesting, taxonomic checks against the GBIF backbone, value assignment and dashboard generation are all automated.
Why it matters. This shows aggregated biodiversity data and standards reaching conservation managers and rangers as practical decision-support tools, and replacing the manual work behind statutory species lists.
In the room
- SANParks manages 21 national parks (about 4.4 million ha terrestrial plus about 370,000 ha of marine protected areas). Kruger National Park is about 2 million ha and turned 100 this year.
- South Africa has about 67,000 animal species, many poorly known and highly endemic.
- Park management plans every five years need updated species lists, which used to be compiled by hand from literature.
- BIMS harvests species and occurrence data from GBIF (occurrences for each reserve plus a buffer and catchment) and adds unpublished literature, databases, books, reports and theses captured by dedicated staff.
- The GBIF taxonomic backbone keeps names to accepted names.
- Users filter by taxon, space, time, Red List status, origin and endemism, and download annotated checklists (Excel, PDF, CSV). The checklists include coordinate uncertainty and precision, record counts, most recent record date, and an include/exclude flag for known misidentifications.
- The dashboards show endemism, origin and conservation status. A Red List view uses SANBI's Red List Index by taxonomic group, and a climate dashboard summarises station data by time period.
Notable moments
Transcript
Automatically generated captions can contain mistakes, especially in names and technical terms. Times are relative to the room recording.
Read the transcript ↓
Related talks.
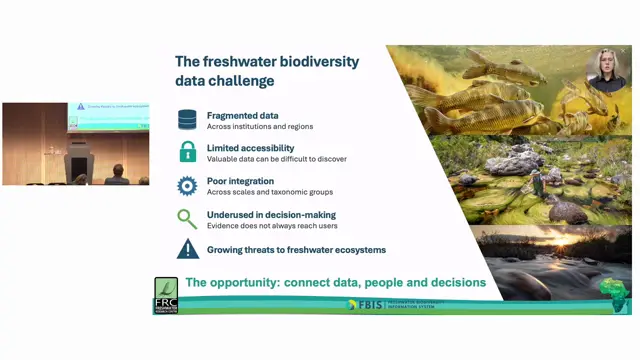
Biodiversity data at your fingertips: open-access freshwater biodiversity information systems for South Africa and Africa
Co-designed, open and interoperable freshwater information systems like FBIS turn fragmented records into decision-ready information, and multi-tenancy helps keep them sustainable.
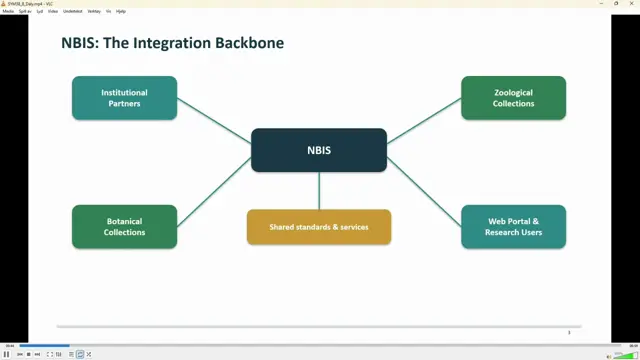
Architecting the National Biodiversity Information System: Standards-Driven Workflows for South Africa’s Botanical and Zoological Data
SANBI sustains NBIS through a statutory mandate plus a roadmap of diversified funding, partnerships and demonstrated return on investment.
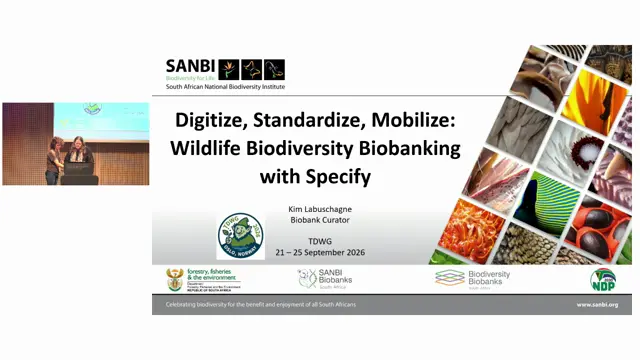
Digitize, Standardize, Mobilize: Wildlife Biodiversity Biobanking with Specify
Specify's hierarchical trees and attachments turned a fragmented wildlife biobank into a traceable extended-specimen data system.