
From NetCDF to Web Maps: Building an Open-Source Web GIS for Biodiversity Data Cubes
Christian Langer · Digital Tools for Data Discovery, Resolution and Exchange
The short versionA simple open-source stack of NetCDF, THREDDS/ncWMS and vanilla JavaScript makes multidimensional biodiversity data cubes browsable and analysable in the browser.
What this was about
Christian Langer presented the EBV Data Portal (portal.geobon.org) and its visualiser for Essential Biodiversity Variable data cubes. EBVs are modelled datasets that sit between raw observations and indicators, and the EBV Cube format stores them as NetCDF with metadata and four dimensions (x, y, time, entity). The portal offers a metadata catalogue, API, DOIs and versioning. The lightweight vanilla-JavaScript web GIS talks to a THREDDS server through ncWMS for map tiles (e.g. gorilla habitat suitability in 1990) and time series for trends in any user-defined region, with DAP4 chunked access. The cons are server limits for very high-resolution global layers (downscaled ×10 for display), THREDDS not being cloud-native (Zarr would be needed) and ncWMS not being a strict OGC WMS.
Why it matters. EBVs are meant to link raw biodiversity data to policy indicators. Making their data cubes easy to explore spatially and over time lowers barriers for researchers and decision-makers.
In the room
- EBVs (GEO BON) are measurements describing biodiversity across time, space and entity: eight classes, e.g. species populations with species distribution as a variable.
- EBVs act as middleware between raw data (in situ, remote sensing, GBIF occurrences) and indicators (aggregated trends).
- The EBV Cube format is NetCDF with metadata and four dimensions (x, y, time, entity) and covers species, traits, habitats, genetics, phenology and more. It is not a competitor to Darwin Core.
- The EBV Data Portal provides a searchable metadata catalogue, API, automatic DOIs and version control.
- The visualiser uses THREDDS and ncWMS requests (GetMap for tiles, GetTimeSeries in JSON/CSV) from a vanilla JavaScript front end; parameters in the URL select metric, entity, time, CRS and bounding box.
- Users can browse by entity, scenario, metric and time and calculate trends for any area of interest, e.g. a national park.
- Pros: lightweight, open source, fast, DAP4 chunk access without downloading whole files. Cons: high-resolution global layers must be downscaled ×10 for display; THREDDS/NetCDF are not suited to S3/cloud storage; ncWMS is only OGC-compliant, not strict OGC WMS.
Notable moments
Transcript
Automatically generated captions can contain mistakes, especially in names and technical terms. Times are relative to the room recording.
Read the transcript ↓
Related talks.
The BMD Cubing Engine: Harmonizing Biodiversity and Earth Observation Data
BMD's cubing engine turns a declarative YAML recipe into reproducible, provenance-documented data cubes that harmonise GBIF occurrences with climate and Earth observation data on one grid.
Reconsidering the original vision for a global biodiversity information facility
GBIF achieved its 1999 vision only partially and through a network of collaborating infrastructures; the community must decide whether that is enough and articulate the next vision.
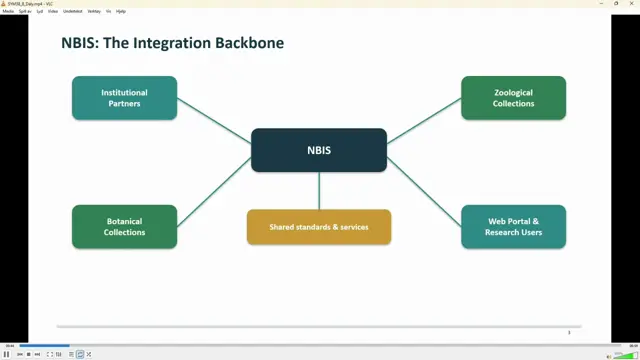
Architecting the National Biodiversity Information System: Standards-Driven Workflows for South Africa’s Botanical and Zoological Data
SANBI sustains NBIS through a statutory mandate plus a roadmap of diversified funding, partnerships and demonstrated return on investment.