
Prototype: The Semantic Units Framework and Rosetta Statements for Knowledge Graph Construction Workflows
Tarek Al Mustafa · Designing Institutional Knowledge Data Science Centres for Biodiversity
The short versionRosetta-statement templates compiled into RML and SHACL make semantic-unit knowledge graphs much easier to author, at the cost of larger graphs.
What this was about
Al Mustafa presented a prototype pipeline that puts Rosetta statements and semantic units into practice for knowledge-graph construction. Using the PhenObs botanical-garden phenology dataset, users fill YAML templates structured by Rosetta statement slots. A compiler then produces executable RML mappings and SHACL shapes, yielding a knowledge graph with layered statement units, compound units and dynamic human-readable labels. Mappings were about four times shorter than conventional ones, but graph size more than doubled.
Why it matters. The prototype shows that the semantic units and Rosetta statement ideas can be implemented with less mapping effort, which matters for bringing institutional research data (e.g., at iDiv) into FAIR, human-readable knowledge graphs.
In the room
- Going from a spreadsheet row (plant, growing season length) to an RDF knowledge graph is harder than it looks.
- Rosetta statements are formalised natural-language statements with syntactic positions and semantic roles (subject, quality, value and unit), with required or optional slots.
- Semantic units give identifiers to collections of triples so that they can be treated as units of meaning with a class, metadata and layers of abstraction.
- A Rosetta statement template library (geo-indexing, time, scientific observations and more) feeds a compiler that outputs valid RML mappings and SHACL shapes for validation.
- Templates cover five dimensions: statement slots, semantic-unit structure, RDF output pattern (akin to ontology design patterns), validation constraints and dynamic labels.
- Users fill a YAML representation instead of RML/R2RML; for PhenObs this cut mapping code from about 4,000 to about 1,000 lines.
- The resulting graph layers statement units over the base data graph, then compound units (flowering, fruiting and senescence traits; vegetative versus reproductive) and time-series units, each separately queryable.
Notable moments
Transcript
Automatically generated captions can contain mistakes, especially in names and technical terms. Times are relative to the room recording.
Read the transcript ↓
Related talks.
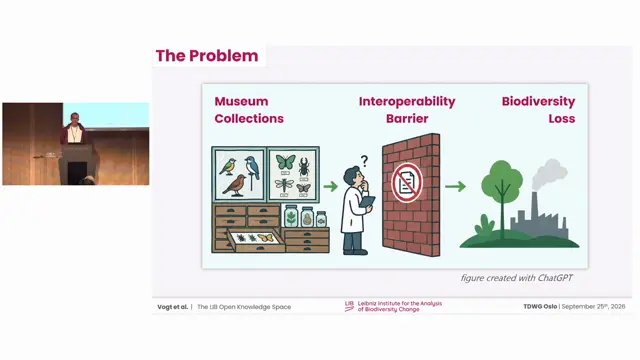
The LIB Open Knowledge Space: A semantic architecture for FAIR, CLEAR, and AI-ready biodiversity knowledge
Knowledge can enter the LIB Open Knowledge Space as natural language immediately and be formalised step by step, so content becomes FAIR, CLEAR and AI-ready incrementally.
BHL and the Planetary Knowledge Base: Structuring Biodiversity Literature for the Next Generation
NHM is re-OCRing all of BHL with modern models and extracting entities into a knowledge graph, with confidence gating to protect BHL data quality.
Using Large Language Models to enhance biodiversity knowledge extraction: From taxonomic treatments to graph-based knowledge systems
Taxonomic treatments hold underused habitat knowledge that LLMs and a provenance-preserving knowledge graph can structure and link to ecoregions, helping map data-poor species.